Stimulated Raman scattering (SRS)
We are using an optical imaging technique based on stimulated Raman scattering (SRS) process for monitoring specific species with high chemical specificity and high spatial and temporal resolution.
We are using an optical imaging technique based on stimulated Raman scattering (SRS) process for monitoring specific species with high chemical specificity and high spatial and temporal resolution. The SRS process relies on two laser beams named pump and Stokes beams coinciding spatially and temporally on the sample under study. When their energy difference matches one of the Raman active frequencies of the sample molecule, a non-linear interaction occurs. This is accompanied by an energy transfer from the pump beam to the Stokes beam. The intensity of the pump beam experiences a loss called stimulated Raman loss (SRL), and the intensity of the Stokes beam experiences a gain called stimulated Raman gain (SRG). Stimulated Raman scattering is a sensitive and molecular specific process; however the signal is weak and can be buried in the laser noise. We developed an optical imaging technique based on spatial modulation of one of the two laser beams (pump beam or Stokes beam) to record the weak SRS signal. The pump beam is spatially modulated with fringes produced in a Michelson interferometer. The gain of the Stokes beam (the SRS signal) is separated from the background in the spatial frequency domain. In this technique we use a Q-switched Nd: YAG laser with an optical parametric oscillator (OPO) system as a source for the pump and the Stokes beams simultaneously.
The frequency doubled beam (532 nm) from the laser is used to pump the molecules under study. The frequency tripled (355 nm) beam from the same laser is used to pump an optical parametric oscillator (OPO). The Stokes beam (from the OPO) is tuned to a specific wavelength so that the frequency difference between the pump and the Stokes beams fits a Raman active vibrational mode of the molecule under study. The two beams are overlapped on the sample resulting in a gain of the Stokes beam intensity and a loss of the pump beam intensity through the SRS process. Two images of the Stokes beam without and with the pump beam fringes are recorded. The normalized image is calculated and Fourier transformed and the gain of the Stokes beam is separated from the background in the Fourier domain. The experimental set up is shown in Fig.1.
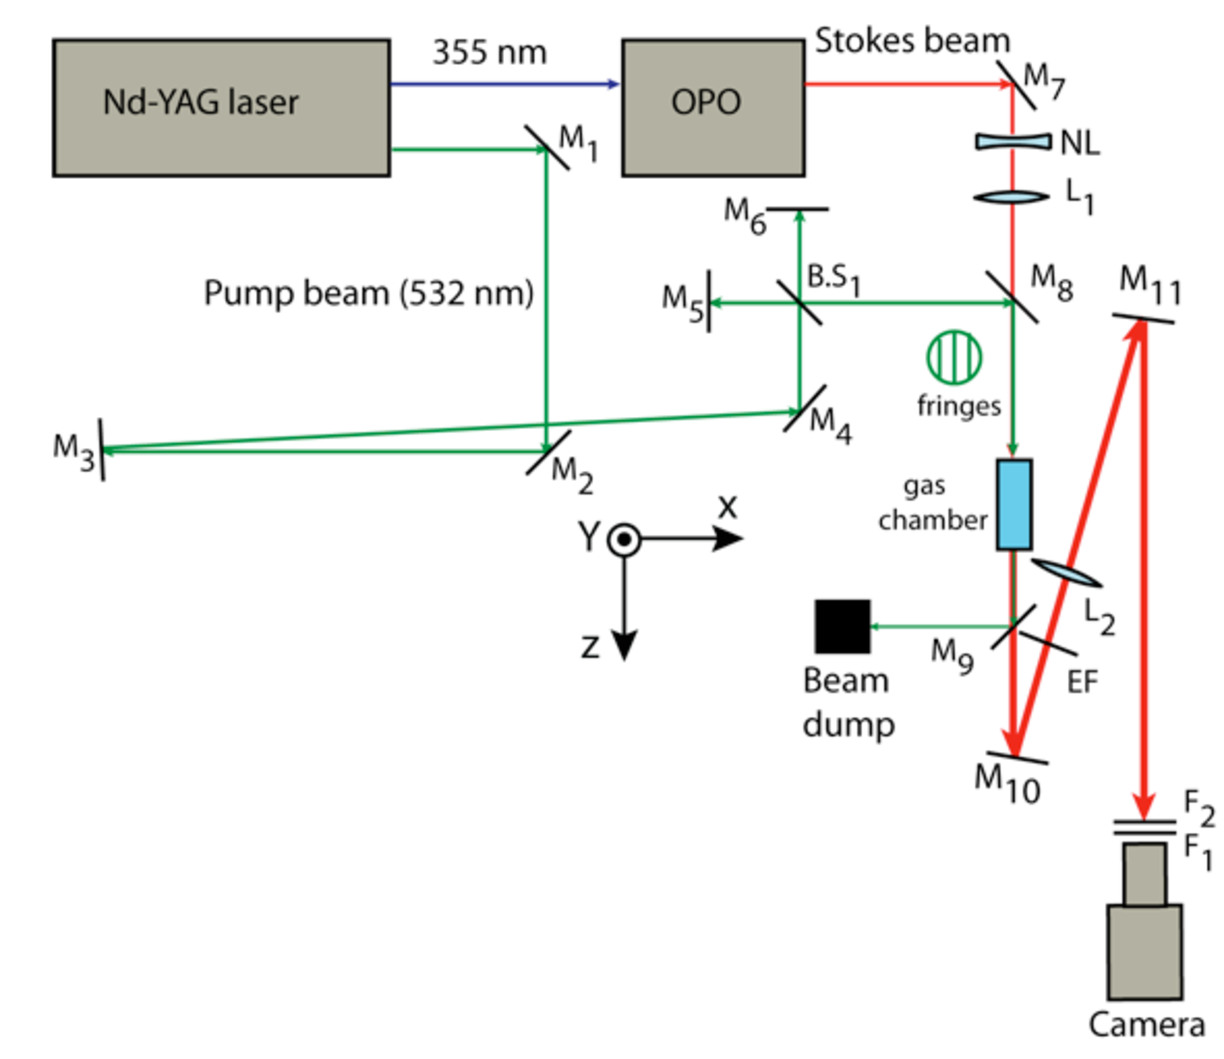
Fig. 1. The experimental setup of the SRS imaging. M: mirrors, B.S: beam splitter, NL: negative lens, L1: collimating lens, L2: imaging lens, EF: edge filter for 532 nm, F1: a red filter and F2: an absorbing filter set.
We applied the technique on solid (polymethyl methacrylate (PMMA)), on liquid (cod liver oil) and on gases (methane (CH4) and ethylene (C2H4)). Results from gases experiments are shown in the following. For methane and ethylene the Raman active modes correspond to the Stokes wavelengths 629.93 nm and 634.05 nm, respectively. Results from a methane gas experiment are shown in Fig. 2.
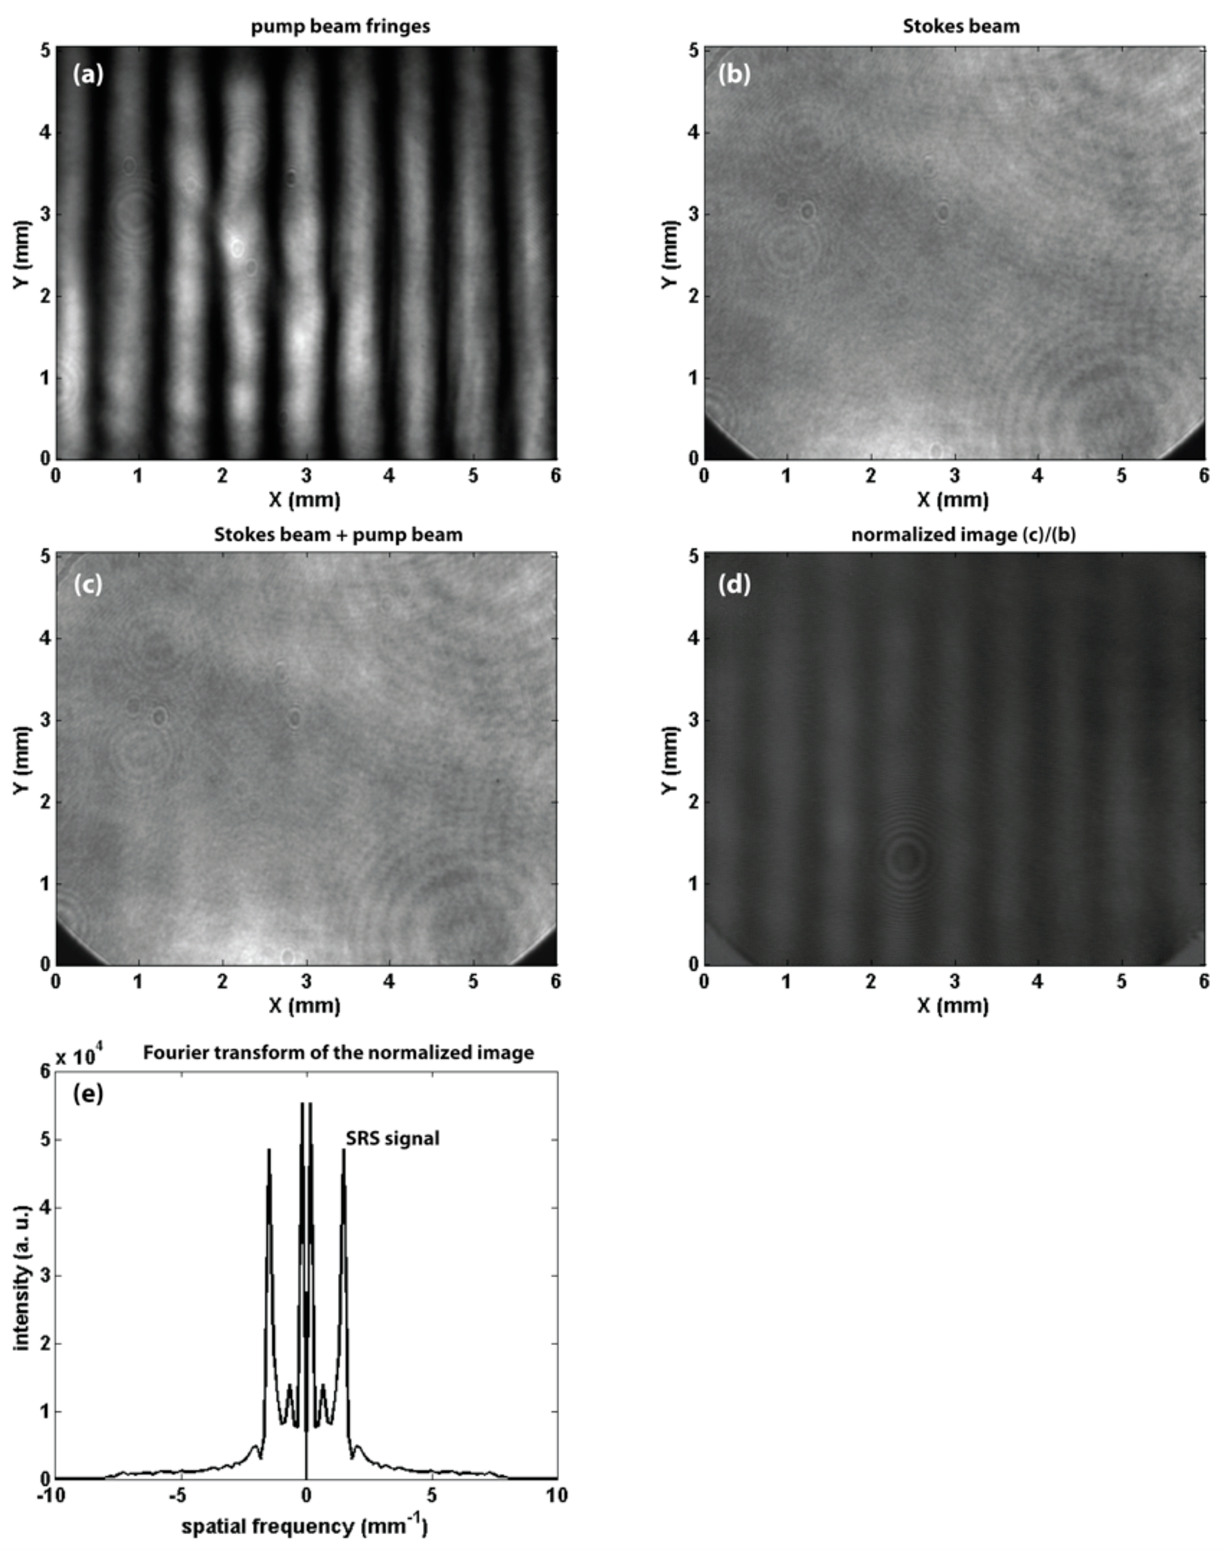
Fig. 2. Results from the methane experiment. (a) An image of the pump beam fringes of spacing 0.67 mm, (b, c) Stokes beam images without and with the pump beam fringes present, respectively, (d) the quotient between the (c) and (b) images and (e) a cross-section of the magnitude of the Fourier transform of the image in (d). The gas pressure is 12 bars, the mean pump beam intensity is 6 MW/cm2 and the Stokes beam intensity is 26 kW/cm2.
The fringe modulation due to energy transfer from the pump beam to the Stokes beam during the SRS process is clearly seen in the normalized image in Fig. 2(d). The cross-section of the magnitude of the Fourier transform of the normalized image (Fig. 2(e)) shows the lobes representing the SRS gain signal are centred in the neighbourhood of about +/- 1.5 mm-1 which corresponds to a fringe spacing of 0.67 mm. Hence the weak SRS signal can be separated from the background. Figure 3 shows the dependence of the SRS gain signal on the CH4 gas pressure. The figure shows that the SRS gain signal increases linearly from 0.25 % at a gas pressure of 1.0 bar to about 2.3 % at 8.0 bars and then it bends to reach 2.6 % at 12 bars. This result shows that the technique is sensitive to the molecule concentration in the interaction volume. To investigate the chemical specificity of the technique, a mixture of the two gases (CH4 and C2H4) was used. The gas chamber was pressurized with CH4 gas to 6.0 bars and then further pressurized from 6.0 to 12.0 bars using C2H4 gas. The wavelength of the Stokes beam was tuned from 628.00 nm to 635.00 nm, the dependence of the SRS gain signal on the Stokes beam wavelength is shown in Fig. 4. The data points were fitted to two Lorentian line-shapes. The figure shows two sharp peaks with line width at half maximum of about 0.3 nm at Stokes beam wavelengths of 629.93 nm and 634.05 nm corresponding to the CH4 and C2H4 gases, respectively. The gain signal is zero in between these two peaks. Hence, specific gas molecules can be identified out of a gas mixture by using the proper wavelengths of the pump and Stokes beam. The technique will provide chemical specificity with real time monitoring capability.
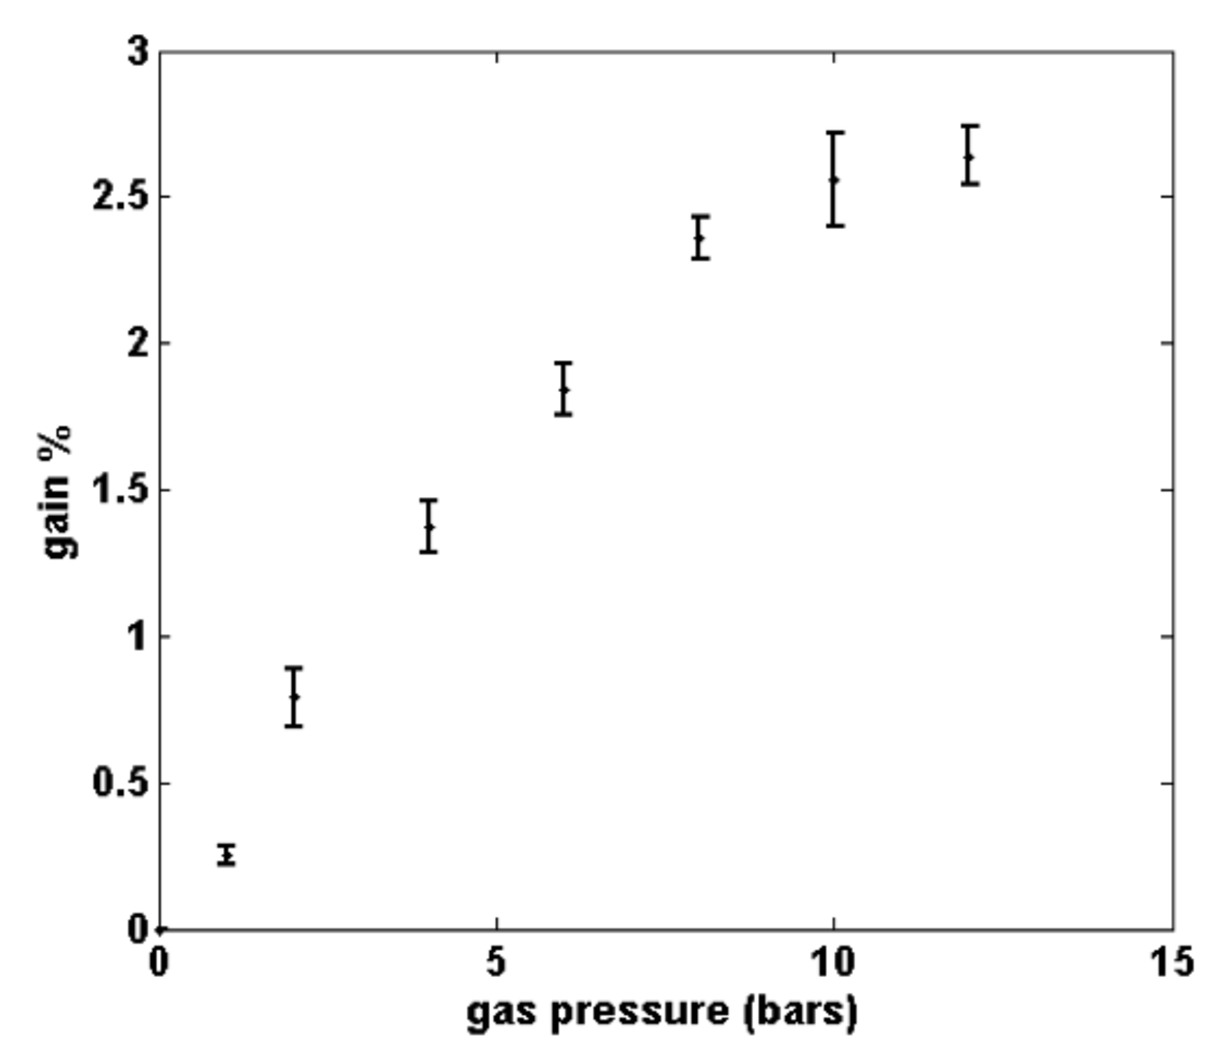
Fig. 3. The dependence of the SRS gain signal on the gas pressure. The mean pump beam intensity is 6 MW/cm2 and the Stokes beam intensity is 26 kW/cm2.
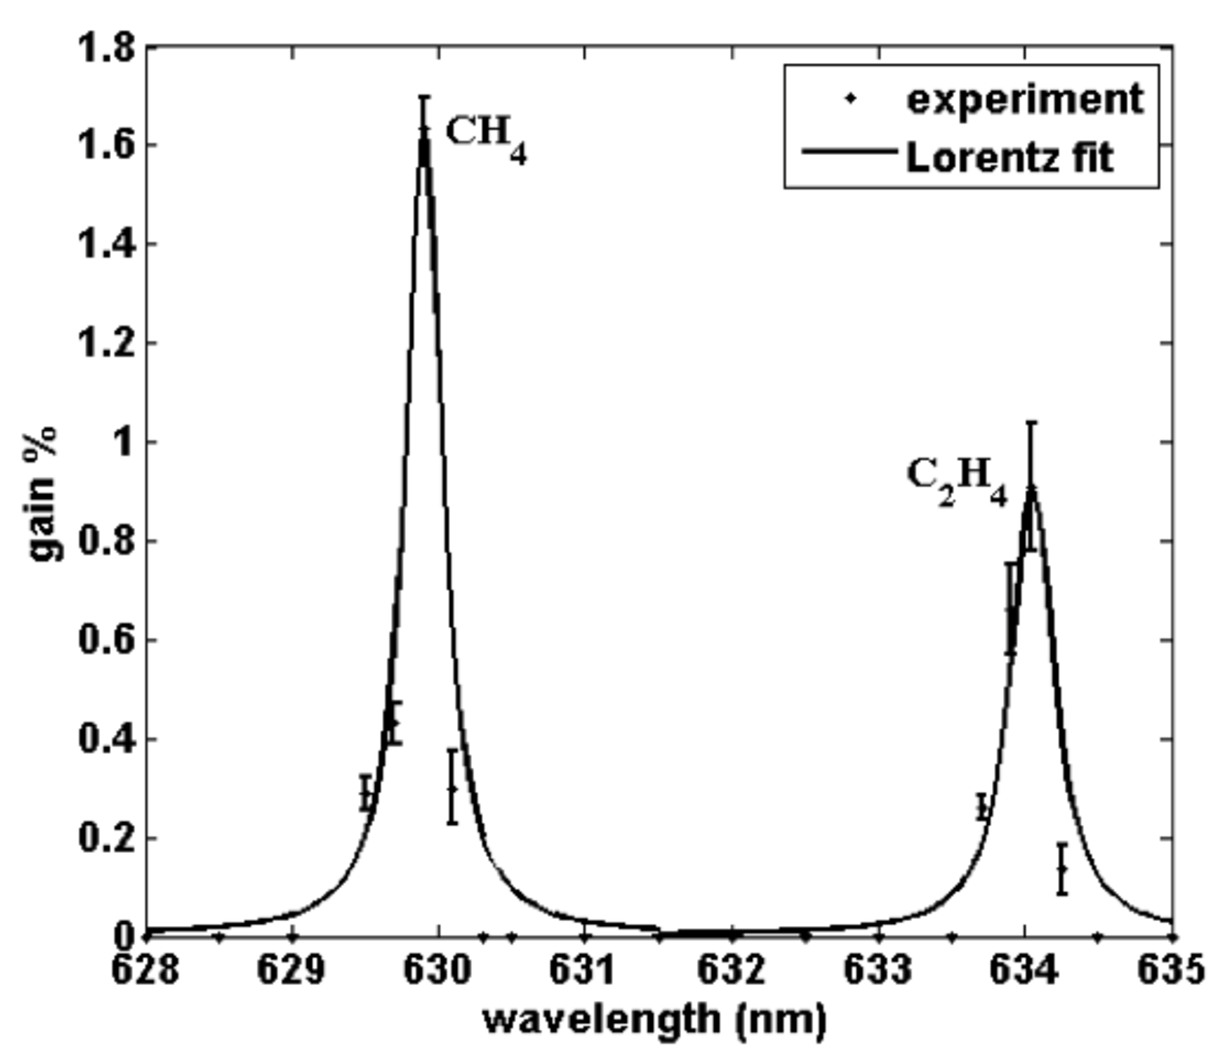
Fig. 4. The SRS gain signal at different wavelengths of the Stokes beam for a gas mixture of two gases (CH4 and C2H4). The mean pump beam intensity is 6 MW/cm2 and the Stokes beam intensity is 26 kW/cm2.
Updated: